Observability is the new cool kid in town that is helping enterprises visualize their infrastructure into a single pane of glass.
Pure Storage has been pushing hard with their adoption of the OpenMetrics and OpenTelemetry standards and have produced OpenMetrics Exporters for both their FlashArray and FlashBlade products.
Pure Storage have created integrations with some of the big players in the Observability world to use the telemetry produced by these OpenMetrics Exporters.
Today the Observability eco-system for Pure Storage just got a little bigger with the release of an integration with Dynatrace, the top rated observability platform, with an extension for the Pure Storage FlashArray.
For current Dynatrace customers who also have, or are considering, Pure Storage FlashArrays in their datacenters, the new extension can be down loaded from the Dynatrace Hub. There are full installation and configuration instructions included in the Hub page for the extension as well as a list of the metrics than can are available from FlashArrays.
In total there are 45 different metrics available to cover items including alerts, hardware, performance, etc.
For a glimpse into the type of data available, here are a few screenshots from Dynatrace with the Pure Storage FlashArray extension installed.
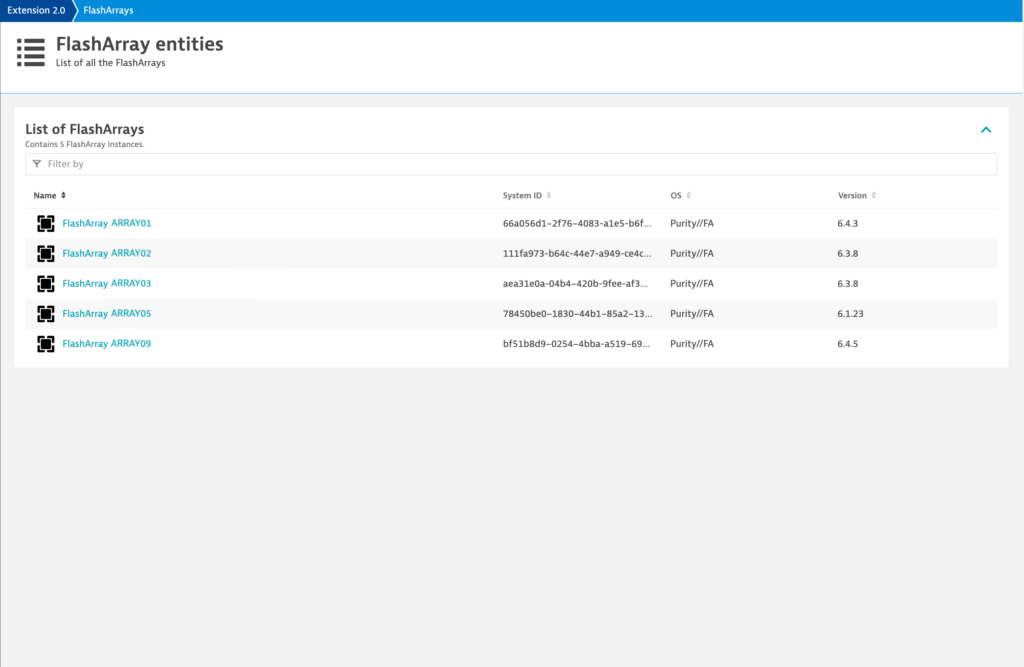
Firstly, the overview screen, with multiple FlashArrays configured and the Array Entities screen.

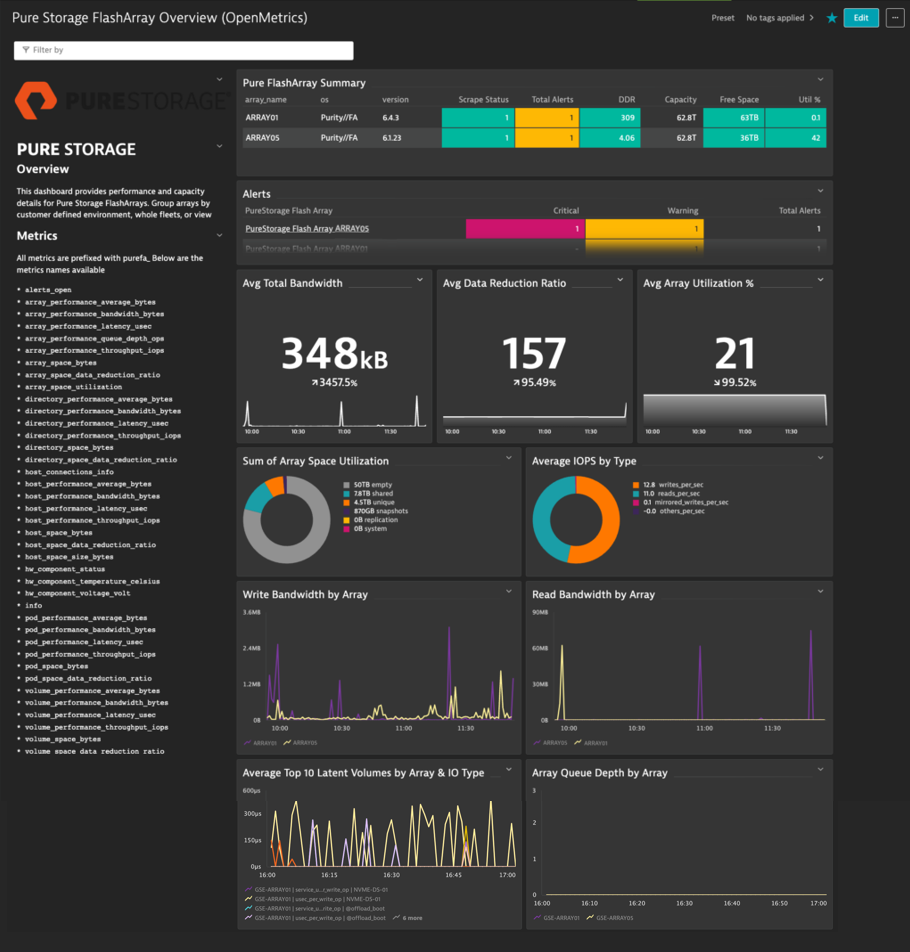
and then the actual Metrics Dashboard
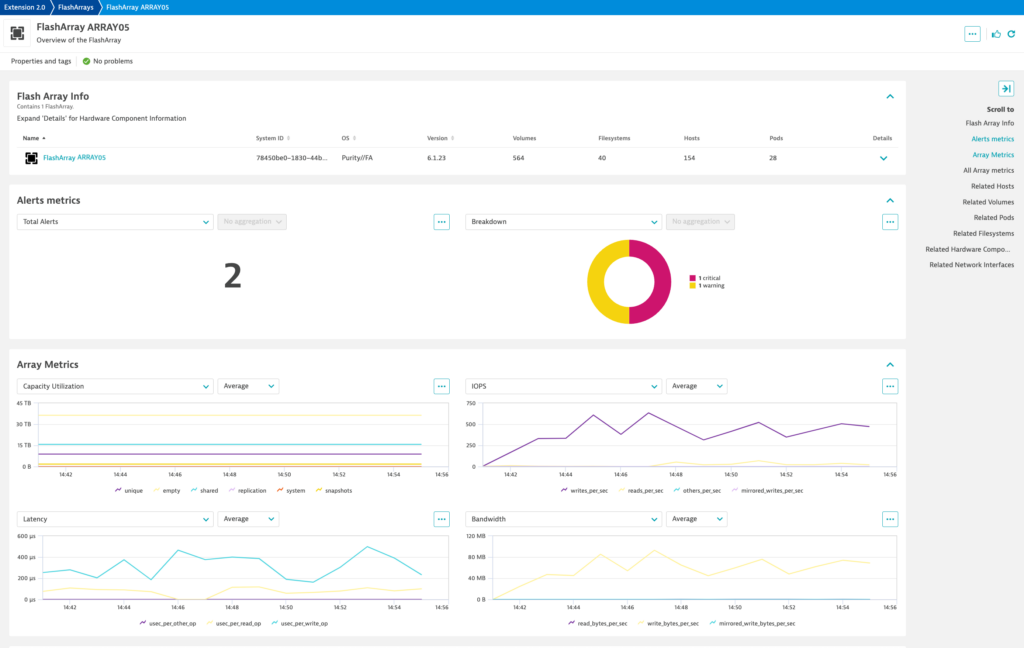
and finally, the overview of a single FlashArray.
I’m not a Dynatrace expert, but I’m told by people who know more than I do that these metrics can be combined into custom dashboards with metrics from other sources, such as networks, compute and even applications.
This allows you to correlate, in near real-time, the whole of your infrastructure.
For more details on the OpenMetrics Exporter for FlashArray checkout it’s GitHub repository.